Interactive Plots in Octave
Here’s a trick I used to present multi-dimensional data with the Octave mathematical programming language. In my particular application, I had a dataset that varies with respect to time, and wanted to examine the structure making up one of the data points at a particular time interval.
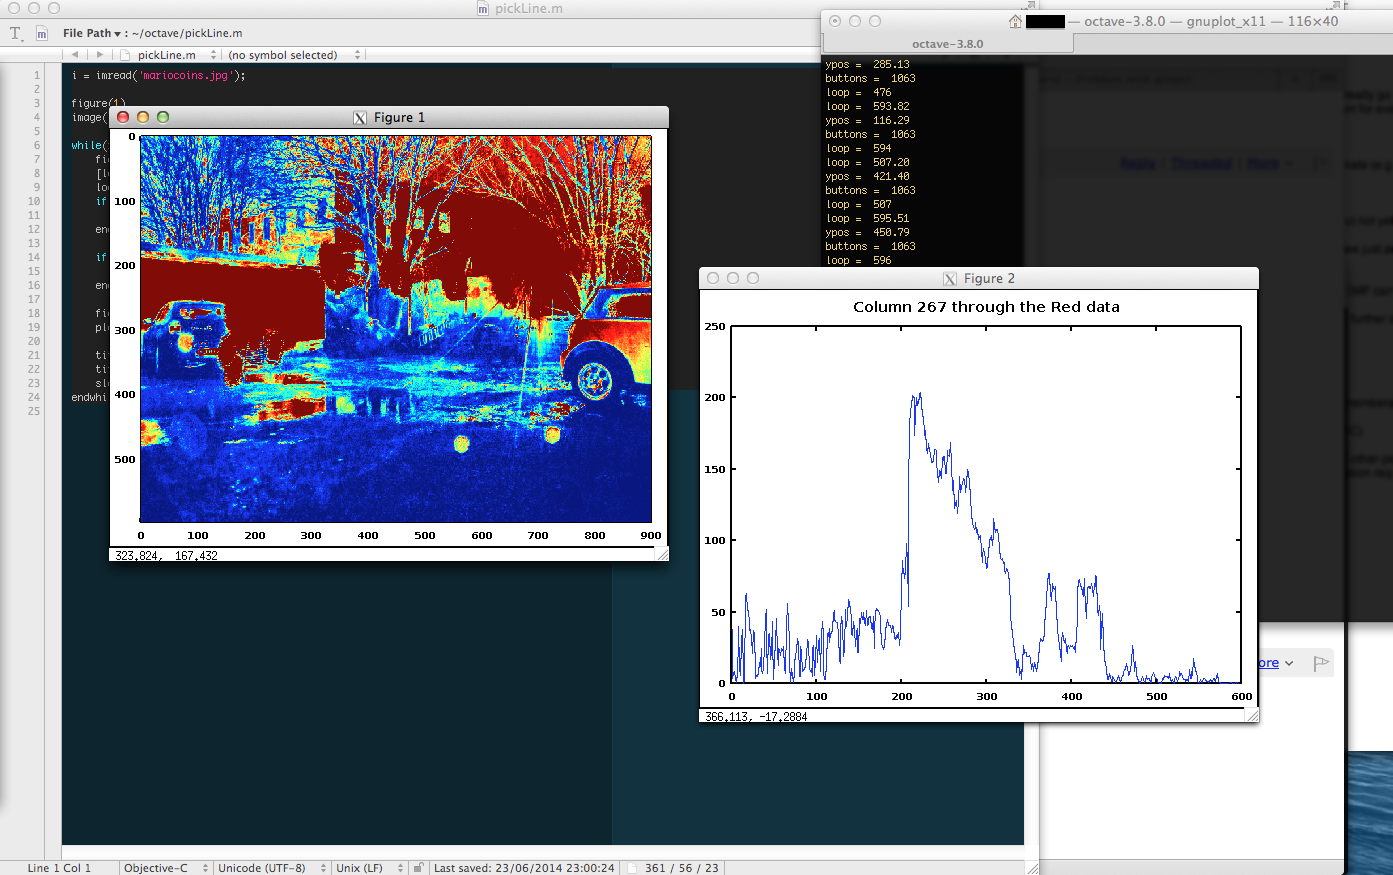
I used the ginput command to detect clicks on the main dataset and then display the sub-structure on a second plot panel. By way of making a tangible example, here’s some code to basically the same thing which selects a column in an image.
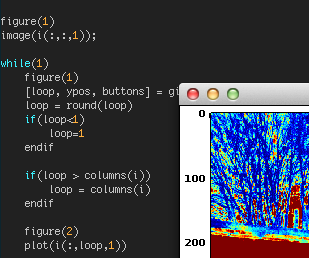
Here’s the code:
#Read an image file and display the first channel in an image plot
i = imread('mariocoins.jpg');
figure(1)
image(i(:,:,1));


while(1)
	figure(1)  #Select the figure containing the image
	[loop, ypos, buttons] = ginput(1) #get the mouse position
	loop = round(loop)
	if(loop<1)
		loop=1
	endif

	if(loop > columns(i))
		loop = columns(i)
	endif

	figure(2) #Select the figure containing the graph and plot to it.
	plot(i(:,loop,1))

	titleText = sprintf('Column %i through the Red data', loop);
	title(titleText, 'fontsize', 14)
	sleep(0.1) #Don't kill your performance
endwhile
If you’re on a Mac, you need to use setenv ("GNUTERM", "x11") to make sure that your grphics terminal interacts with your mouse (the default AquaTerm doesn’t). On Windows and Mac, make sure that your graphics toolkit is gnuplot.